
How to Track Analytics in Icegram Engage
ProTrack impressions, click-throughs, and conversion rates for your on-site messages and campaigns in Icegram Engage.
Icegram Engage automatically tracks how visitors interact with your on-site messages, giving you clear visibility into what campaigns perform best.
Key Metrics Tracked

- Impressions: The total number of times a message was displayed to visitors.
- Conversions / Clicks: The number of times visitors clicked the primary call to action (or submitted an opt-in form).
- Conversion Rate: The percentage of impressions that led to a conversion (
Clicks ÷ Impressions × 100).
Where to Find Your Analytics
1. Campaigns & Messages Overview Lists
The main Icegram Engage > Campaigns listing page provides an aggregate performance snapshot for every campaign, making it easy to identify top-performing campaigns at a glance.
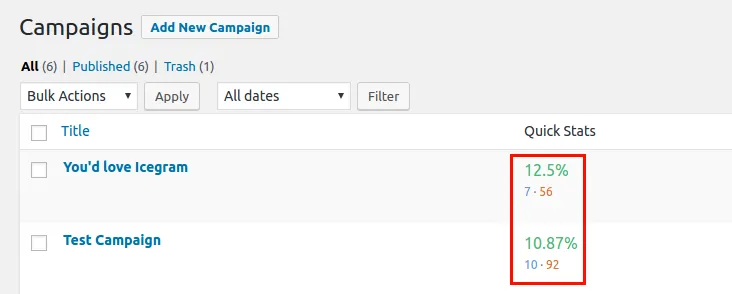
You can see a similar breakdown on the Messages listing page for every individual message type.
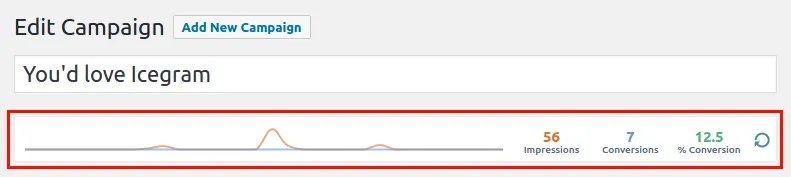
2. Campaign Edit Screen
When editing a specific campaign, an analytics panel at the top shows the total impressions, clicks, and average conversion rate across all messages included in that campaign.
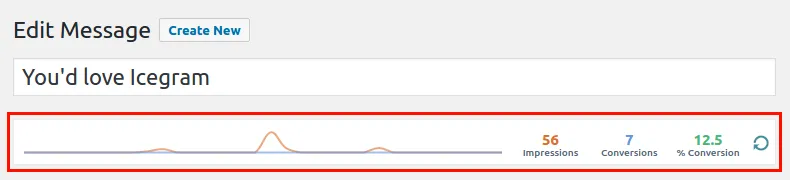
3. Individual Message Edit Screen
To inspect granular performance for a single message, navigate to Icegram Engage > Messages and open the message. The top bar shows exact impressions and clicks attributed to that specific message.