What analytics does Icegram Express track?
The role of analytics is crucial when it comes to engaging a targeted audience. So, in Icegram Express, whenever you send an email campaign to your subscribers, you can monitor your campaign performance and find out what works best for you. All these stats and analyses for campaigns can be viewed from the Reports screen in the plugin.
The tracking summary of the past 60 days can be viewed on the Icegram Express > Audience > Dashboard of Icegram Express.
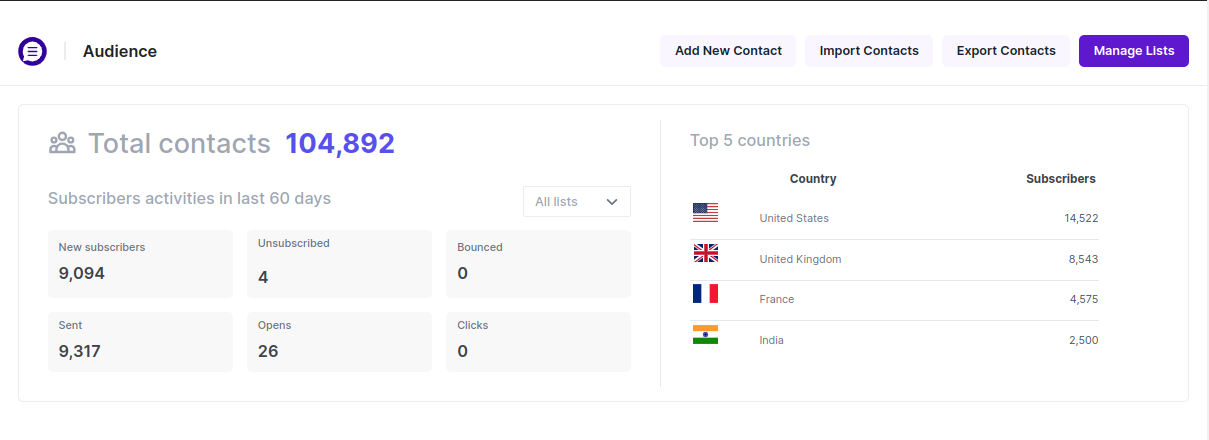
- Total Contacts: Refers to contacts who submitted the subscription form in the past 60 days.
- Sent: Indicates the total number of emails sent through Icegram Express in the last 60 days.
- Open: Represents the total number of emails opened by the subscribers.
- Click: The actual click rate of subscribers who clicked on a CTA button. This feature is available in Icegram Express Max.
- Unsubscribe: Shows the total number of email unsubscribes from your list. In the Max plan, hovering over it will display a pie chart showing reasons for unsubscribing.
- Bounce: Indicates the total number of bounces, including both hard and soft bounces. You can click here to learn more.
So, you may be wondering where to find stats for some particular campaign?
This information is mainly available on the Report page (Icegram Express > Reports Page > View). Let’s dive into the track report of the particular campaign.
Icegram Express Max Feature
- Reports Overview:
In this section, you will get an overview of the campaign information such as:
- Top campaigns: You will find the best performing campaigns here in the past 60 days
- From: Sender’s Email Address.
- Recipient: Targeted Audience Lists.
- Date: The date on which the campaign is sent.
- KPI’s: This will provide you with a summary of your campaign which includes information like;
- Opened: The total number of emails opened by the subscribers in this particular campaign.
- Clicked: An average click rate is the percentage of subscribers who clicked on a CTA button or link present in an email.
- Sent: It is the total number of emails sent in this campaign.
- Unsubscribed: The total number of contacts who unsubscribed in this particular campaign.
- Open and Click Activity

In this section, you will get an overview of the campaign in terms of Open and Click rates. This graphical representation will help you understand the daily total number of emails opened and links clicked in the emails.
- Country Info

Country Info: It will showcase the top 5 countries and their open rates, this information will help you target the audience according to their geo-location as the open rate will give you a clear image of the active subscribers in the respective country. Mail Client info: Mail client info shows the top 5 mail clients’ open rates. Examples of mail clients such as – Gmail, Apple Mail, Yahoo Mail!, Outlook, etc.
- Device, Browser, and Operating System information
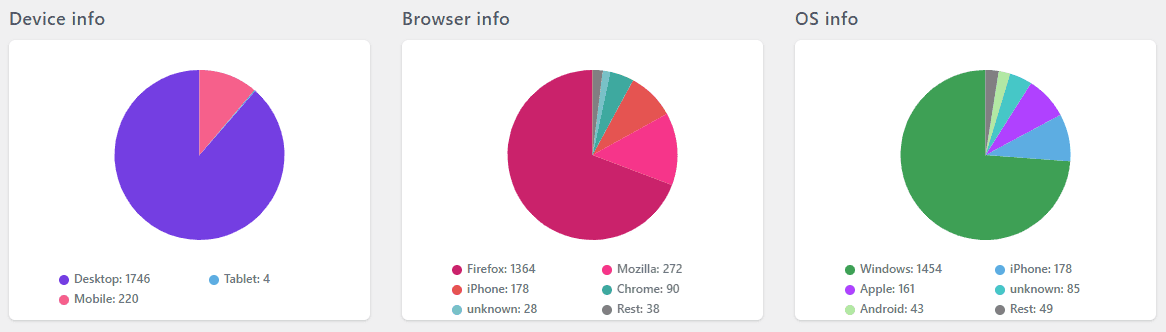
- Device information: Provide analytics such as what type of device your targeted audience is using such as mobile, desktop, or tablet.
- Browser information: Provide analytics such as Which browser your subscribers are using (Chrome, iPhone, Mozilla, etc)
- OS information: Provide analytics such as which Operating system your subscribers are engaged with e.g., Windows, Apple, Android, etc.
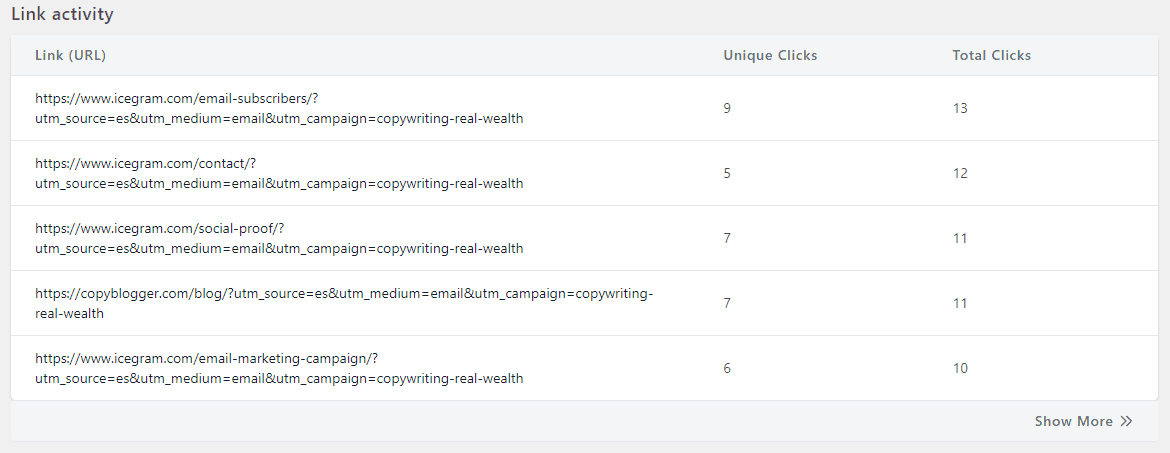
- Link Activity: In this analytics, the admin can track the numbers of engagement through links in the campaign in email.
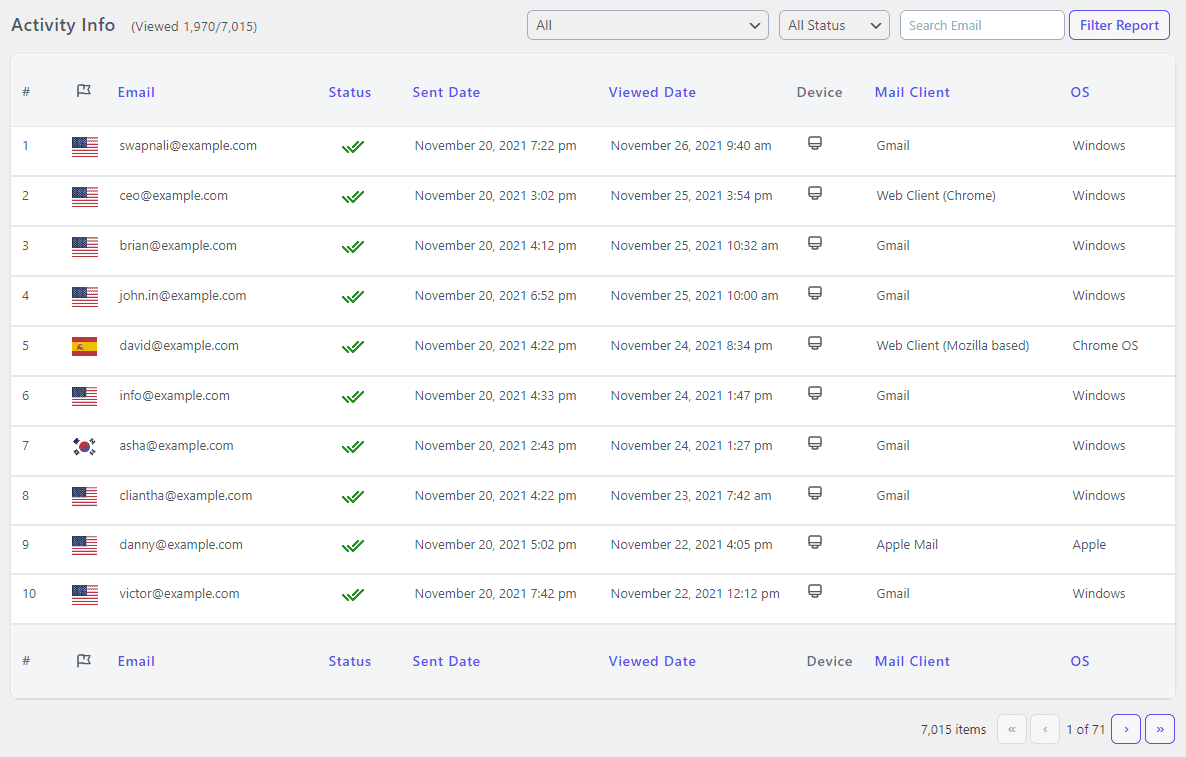
- Activity Info:
In this section, you can view a list of Emails and information related to them like – Viewed, Status, Sent Date and View Date, Device, Mail client, and Operating system (OS) Total contact in the campaign and Opened Emails.
Each information will help you understand deeper about your audience.
- Mail Client:
Mail client info shows the top 5 mail clients’ open rates.
Examples of mail clients are – Gmail, Apple Mail, Yahoo Mail!, Outlook, etc.
OS: It indicates the Operating System of the device that the subscriber has used while opening the email.
Filters: We can filter out the activity info by adding filters such as selecting Country, Open/Not Open Status, and by simply searching any contact through the search bar.
Icegram Express Lite Feature
- Viewed: It shows the total number of emails opened compared to the total emails sent.
- Status: If the status symbol is a single tick, that indicates the email is sent to the particular contact whereas, a double tick with a green color indicates the email has been opened by that contact, a yellow arrow indicates the email is being sent to that contact whereas, an orange clock icon indicates the email is in the queue.
- Sent Date: It shows the date and time when the email was sent to the contact.
- View Date: Indicates the date and time when the email is opened by the subscribers.