How to Track Analytics in Icegram Engage
This feature is available in Icegram Engage Premium plans.
Activate the Icegram Engage Plus, after installation. (I'm assuming you are already using Icegram Engage! If not, download and activate Icegram Engage too.)
Once activated, It will start tracking statistics automatically. Whenever a visitor sees or clicks on any Icegram Engage message, it will be all tracked.

Statistics snapshot
- An impression is when a message is shown to the visitor.
- A conversion is when the visitor clicks on a call to action button.
- Conversion rate is percentage of visitors who clicked on a CTA button.
Where do I find these statistics?
So you may be wondering where to find these stats?
There are mainly 3 places where analytics results show up.
Overall analytics show on campaigns / messages list pages
If you want to compare different campaigns, you can get their stats on the campaigns listing page. This is great overview, because you can quickly identify the winning campaigns!
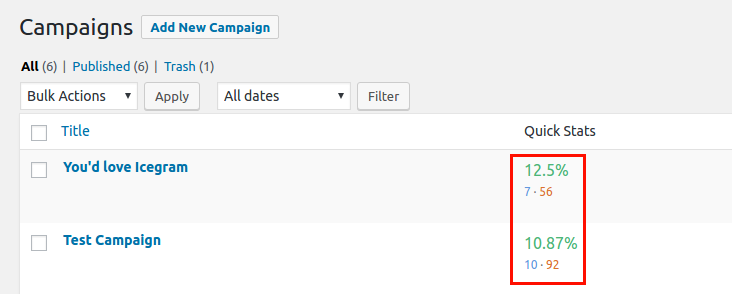
Similar stats are available on the Messages listing page within Icegram Engage.
Single Campaign analytics show on Edit Campaign page
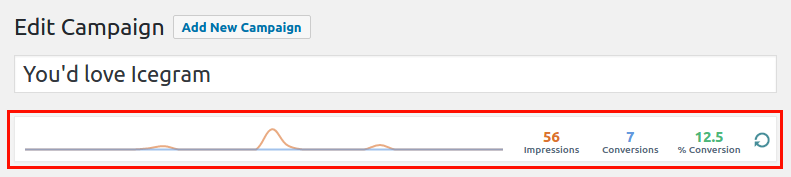
Edit Campaign Page showing stats for this campaign
Statistics for each individual campaign also show on Campaign edit page. They show how many messages from this campaign were shown, clicked on and the conversion rate. This is a great aggregate analysis of all messages you are running in a campaign.
Individual Message analytics show on Edit Message page
If you wanted to track how well a specific message is doing, go to Message edit page.(WP Admin – Icegram Engage – Messages – click on a message to edit)
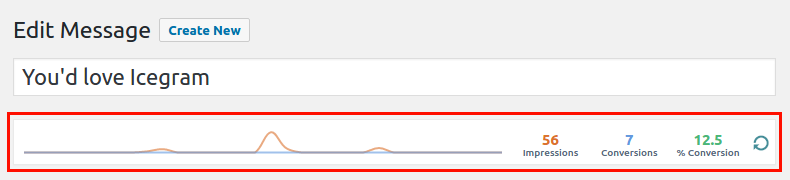
Edit Message Page Analytics
Read more about Icegram Conversions & Impressions Analytics.